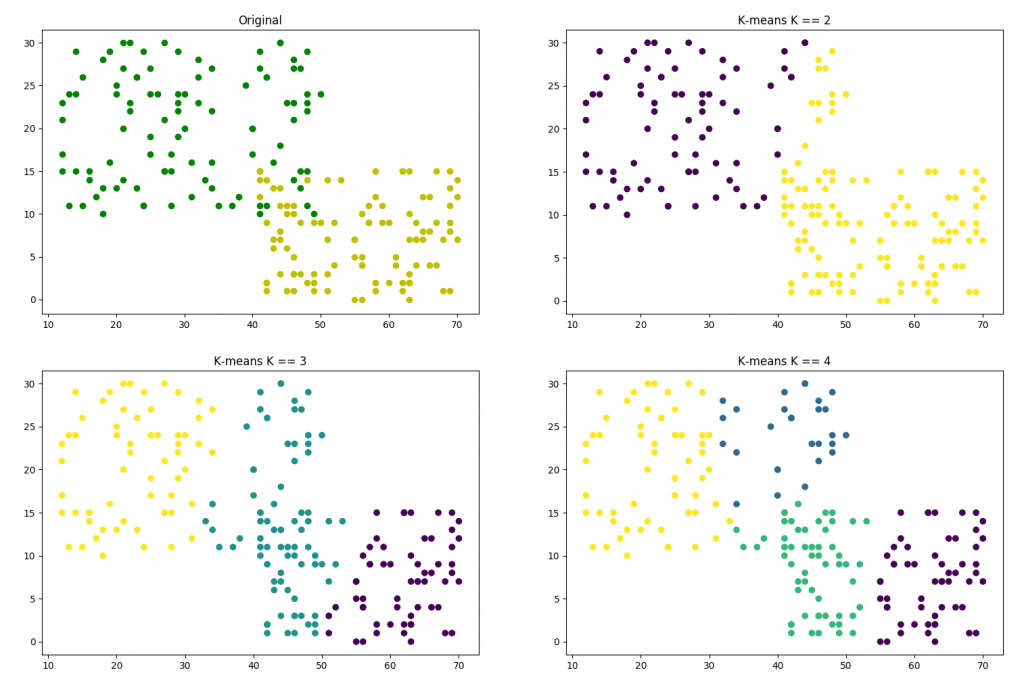
In the ICME machine learning workshop, the presenter talked about the algorithm of K-means to do the data clustering. It’s a simple and interesting algorithm. The following is a simple example, which generates the sample data, sets different K.
|
1 2 3 4 5 6 7 8 9 10 11 12 13 14 15 16 17 18 19 20 21 22 23 24 25 26 27 28 29 30 31 32 33 34 35 |
import matplotlib.pyplot as plt import numpy as np from sklearn.cluster import KMeans if __name__ == '__main__': example2ds = [] plt.figure(figsize=(12,12)) x_ranges = [(10, 50), (40, 70)] y_ranges = [(10, 30), (0, 15)] z_labels = [1, -1] plt.subplot(221) for x_range, y_range, z_label in zip(x_ranges, y_ranges, z_labels): x1 = np.random.random_integers(x_range[0], x_range[1], 100) y1 = np.random.random_integers(y_range[0], y_range[1], 100) #z1 = np.random.choice([-1,1], 100) for x, y in zip(x1, y1): example2ds.append([x, y]) plt.scatter(x1, y1, marker='o', c = 'g' if z_label == 1 else 'y') plt.title('Original') the_array = np.array(example2ds) for k in [2,3,4]: kmeans = KMeans(n_clusters=k).fit_predict(the_array) plt.subplot(2, 2, k) plt.scatter(the_array[:,0], the_array[:,1], marker='o', c=kmeans) plt.title('K-means K == {}'.format(k)) plt.show() |